
First, a couple of updates with regards to my big 8-part, 2.5 hour economics video presentation, available on my YouTube channel.
There are fresh numbers through December 31, ARSH 2013 for derivatives exposure for the top 25 banks in the U.S. (That table is about 3/4 of the way down the document. I covered this in part 7)
The top 25 banks in the U.S. now hold $304 TRILLION in notional derivatives value. The top 5 banks are as follows:
JP Morgan: $70.4 TRILLION
Citigroup: $63.5 TRILLION
Bank of America: $55.7 TRILLION
Goldman Sachs: $53.5 TRILLION
Morgan Stanley: $46.7 TRILLION
TOTAL Derivatives Exposure for Top 5 Banks in the U.S.: $290 TRILLION
In Part 7 of my video presentation, I made the point that even if one agues that there will be an offsetting symmetry in the inevitable collapse of the financial bubble and in these derivative markets that will “cancel out” 90% of these values (I referred to it as a “haircut”), an assumption confirmed in Graph 5B (about halfway down the document), We are still talking about $29 TRILLION, or just shy of DOUBLE the entire Gross Domestic Product of the United States – that is the sum total of EVERY GOOD AND SERVICE produced in the United States in one year.
To put this in another perspective, let’s quote this in terms of acres of land. The total landmass of the planet earth is 36.8 billion acres. If we divide $290 TRILLION by 36.8 BILLION acres, we get $7880 per acre. Give that our 90% haircut, and you’re still looking at $788 per acre for every single acre of land on the entire planet. I use these units because, as I have stated many times, mass defaults have been settled historically in landmass reallocation and human life – both in the form of bloodshed AND in the form of capturing/redirecting human economic output from the defaulting nationstate to serve the creditor nationstate. But really, the two go hand-in-hand, because when landmass is shifted from one state to another, the people who live on that landmass and their economic output go with it.
—
Now an update of Karl Denninger’s famous chart of quarter-to-quarter change in both U.S. GDP and Debt. My economics presentation which used and explained KD’s chart in part 4 was recorded in November of ARSH 2012. Things have gotten much, much worse since then, and the debt bubble is being inflated again to fake the appearance of “economic growth” to people who are either too ignorant, too stupid (and thus not able to understand the concept even after it is presented and explained), or simply too dishonest to acknowledge mathematical reality. Here is the updated chart:
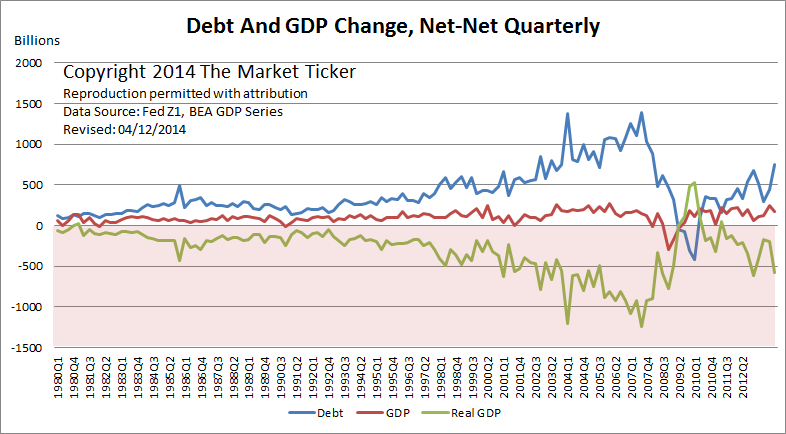
Source: Karl Denninger, Market-Ticker.org
Okay. Let’s walk through this again. This chart shows QUARTER-TO-QUARTER CHANGE, not gross values. If, for example, GDP increased by $100 Billion from $15.4 Trillion in Q1 of 2010 to $15.5 Trillion in Q2 of 2010, the Q2 2010 plot point would be +$100B. Every plot point is the amount of change versus the previous quarter. Thus:
-If the line is above zero and upward-sloping, the overall increase accelerated from the previous quarter.
-If the line is above zero but downward-sloping, the rate of increase decelerated from the previous quarter.
-If the line is below zero and upward-sloping, there was an overall decrease that was less than the previous quarter.
-If the line is below zero but downward-sloping, there was an overall decrease that accelerated from the previous quarter.
The RED line is the GDP line (quarter-to-quarter change).
The BLUE line is the DEBT line of all sectors, both public and private (again, quarter-to-quarter change).
The GREEN line is the GDP line MINUS the DEBT line.
Why did KD add that GREEN line, which nets the RED and BLUE lines together? Because, if it takes more than $1 of new debt to create $1 in GDP growth, then your economy is NOT GROWING, it is CONTRACTING. Thus, when the GREEN line is below zero (in the shaded zone of the plot field), your economy is actually in a CONTRACTION, BEING PROPPED UP AND GIVEN THE FAUX-APPEARANCE OF GROWTH BY THE BLOWING OF A MASSIVE DEBT BUBBLE.
So, yes, reviewing, the entire U.S. economy is a massive, massive debt bubble and has been since the Carter Administration. We are consuming things today which we DO NOT HAVE THE MONEY TO PAY FOR from today’s production, thus we must borrow that money from our “older selves” and from future generations. Terrifyingly, if you look at the GREEN line, what you see is that we don’t need to borrow to simply HOLD at zero growth – our economy is so bad that we would need to borrow money to have our GDP contract *only a mere* $500 billion – because the GREEN line today is at roughly -$550 Billion. Yeah. In order to have the gross GDP in the last recorded quarter contract *only* $500 billion, we would STILL need to incur $50 billion in NEW DEBT.
Now, look at how far above the RED GDP line the BLUE debt line is. Right now, it requires roughly $4 of NEW DEBT to generate $1 of gross GDP growth. As you can see from the chart, back in the mid-2000s, that ratio got out to 7:1. It was taking $7 of new debt to create $1 in GDP growth. We are quickly moving back out to those levels. Remember this when you see the headlines about “new highs in the Dow” and the residential real estate “recovery”.
-*-
Two interesting stats with regards to the islamic political system:
The total GDP of the entire musloid world, excluding petroleum, from Morocco to Bangladesh (excluding Indonesia) is LESS than the GDP of the American state of Georgia. What this means is that the islamic political system, like its younger sibling Marxism, causes people to sit around and do ABSOLUTELY NOTHING.
And in a related vein, there are more books translated each year into Modern Greek, which is spoken ONLY in Greece and Cyprus (combined population of just over 12 million people) than there are books published, both translations and original works, in Arabic, which is spoken in 26 nations with at least 420 million mother-tongue speakers, and is the official language of the musloid political system, which has under its jackboot some 1.2 billion souls.
So no, the lack of economic productivity among musloids is NOT because they are all sitting around reading and cultivating their intellects.